Where does the workday go? What a week of tracking shows
By Aditya Trivedi ·
To find out where your workday goes, count it for a week instead of guessing. Studies find that people’s estimates of their own screen time rarely match what was logged. A week of measured browsing shows which sites lead, which days run long, and how much goes to sites that aren’t work. Below is one example week, read line by line, and what to try next.
We make Pawsome Family, a Chrome and Edge extension whose Screen time counts how long each website is on your screen. The numbers below are sample data from the app’s own screens, not a real person’s week. If you haven’t counted a week yet, here’s how to start.
Why a guess isn’t enough
- Guesses miss in both directions. A 2021 review pooled 44 studies that compared what people reported about their digital media use with what was logged. The two were only moderately related. In just 3 of 49 comparisons was the average guess within 5% of the log, and people over-reported about as often as they under-reported.
- Some habits go unnoticed. In a study of 238 iPhone users, the average guess of daily phone time was close to the logged figure, but individual guesses were loose. People also guessed only about half the number of times they actually picked up their phone.
The example week
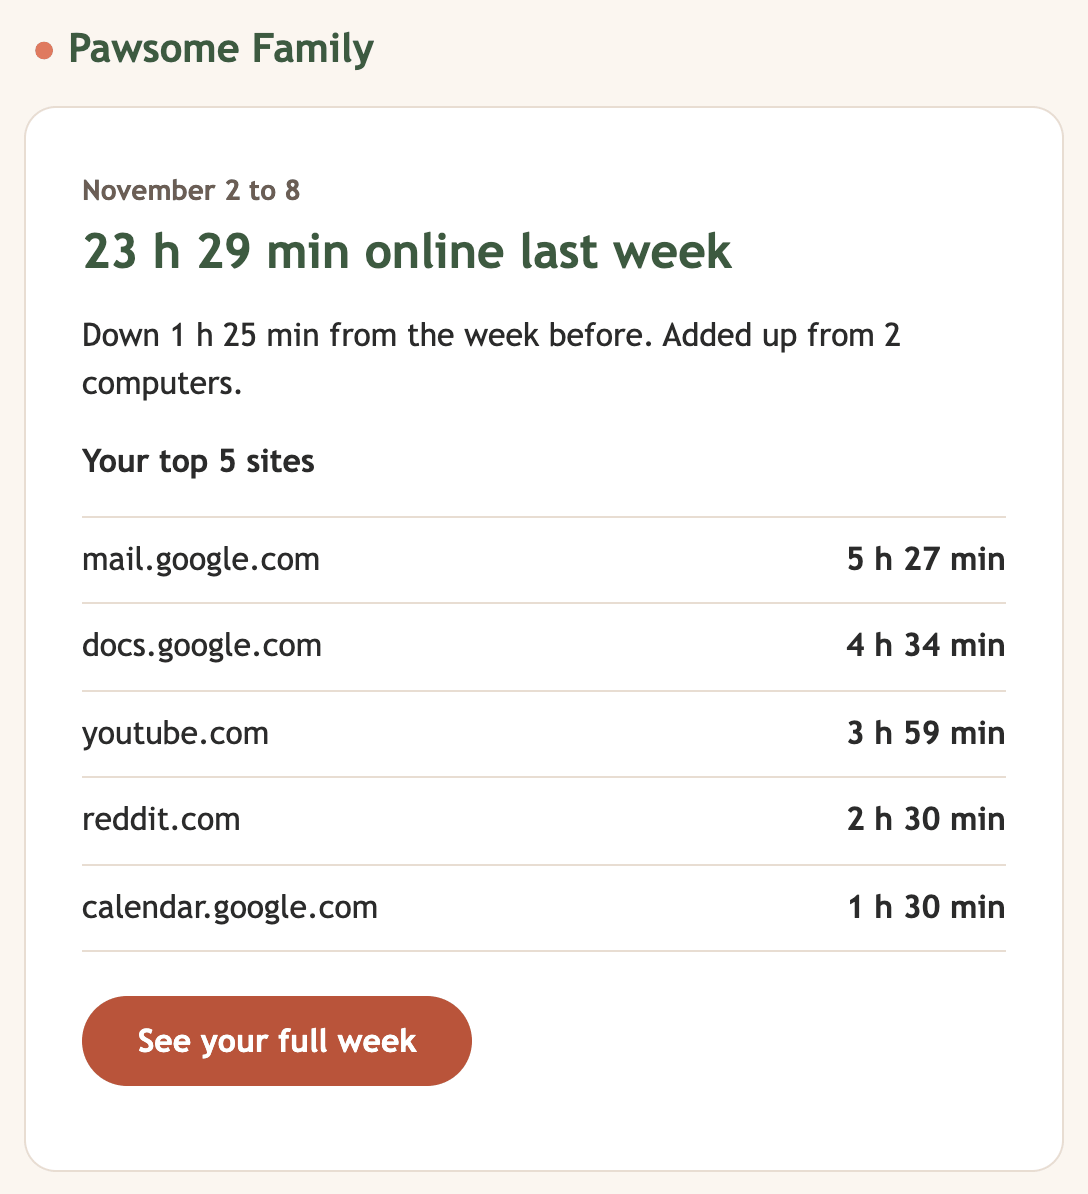
This example Monday email covers November 2 to 8. It shows 23 h 29 min in the browser, down 1 h 25 min from the week before, added up from 2 computers. Here’s how that week splits:
| Site | Time | Share of the week |
|---|---|---|
| mail.google.com | 5 h 27 min | 23% |
| docs.google.com | 4 h 34 min | 19% |
| youtube.com | 3 h 59 min | 17% |
| reddit.com | 2 h 30 min | 11% |
| calendar.google.com | 1 h 30 min | 6% |
| All other sites | 5 h 29 min | 23% |
Reading it line by line:
- Email is the biggest single item. Almost a quarter of the week went to mail.google.com.
- Work tools take about half. Email, documents and the calendar add up to 11 h 31 min.
- Two other sites take more than a quarter. youtube.com and reddit.com add up to 6 h 29 min. Some of that may be work, like a tutorial video. Screen time counts sites, not pages or videos, so only you know which.
- The top five are most of it. They add up to 18 hours of the 23 h 29 min.
- The average day is about 3 h 20 min, but days aren’t average. The bars on the Screen time page show which ones ran long.
The full Monday email, with the change from the week before and the top 5 sites, comes with the trial or the plan. Without the plan, it has the week’s total only.
A month of the same habits
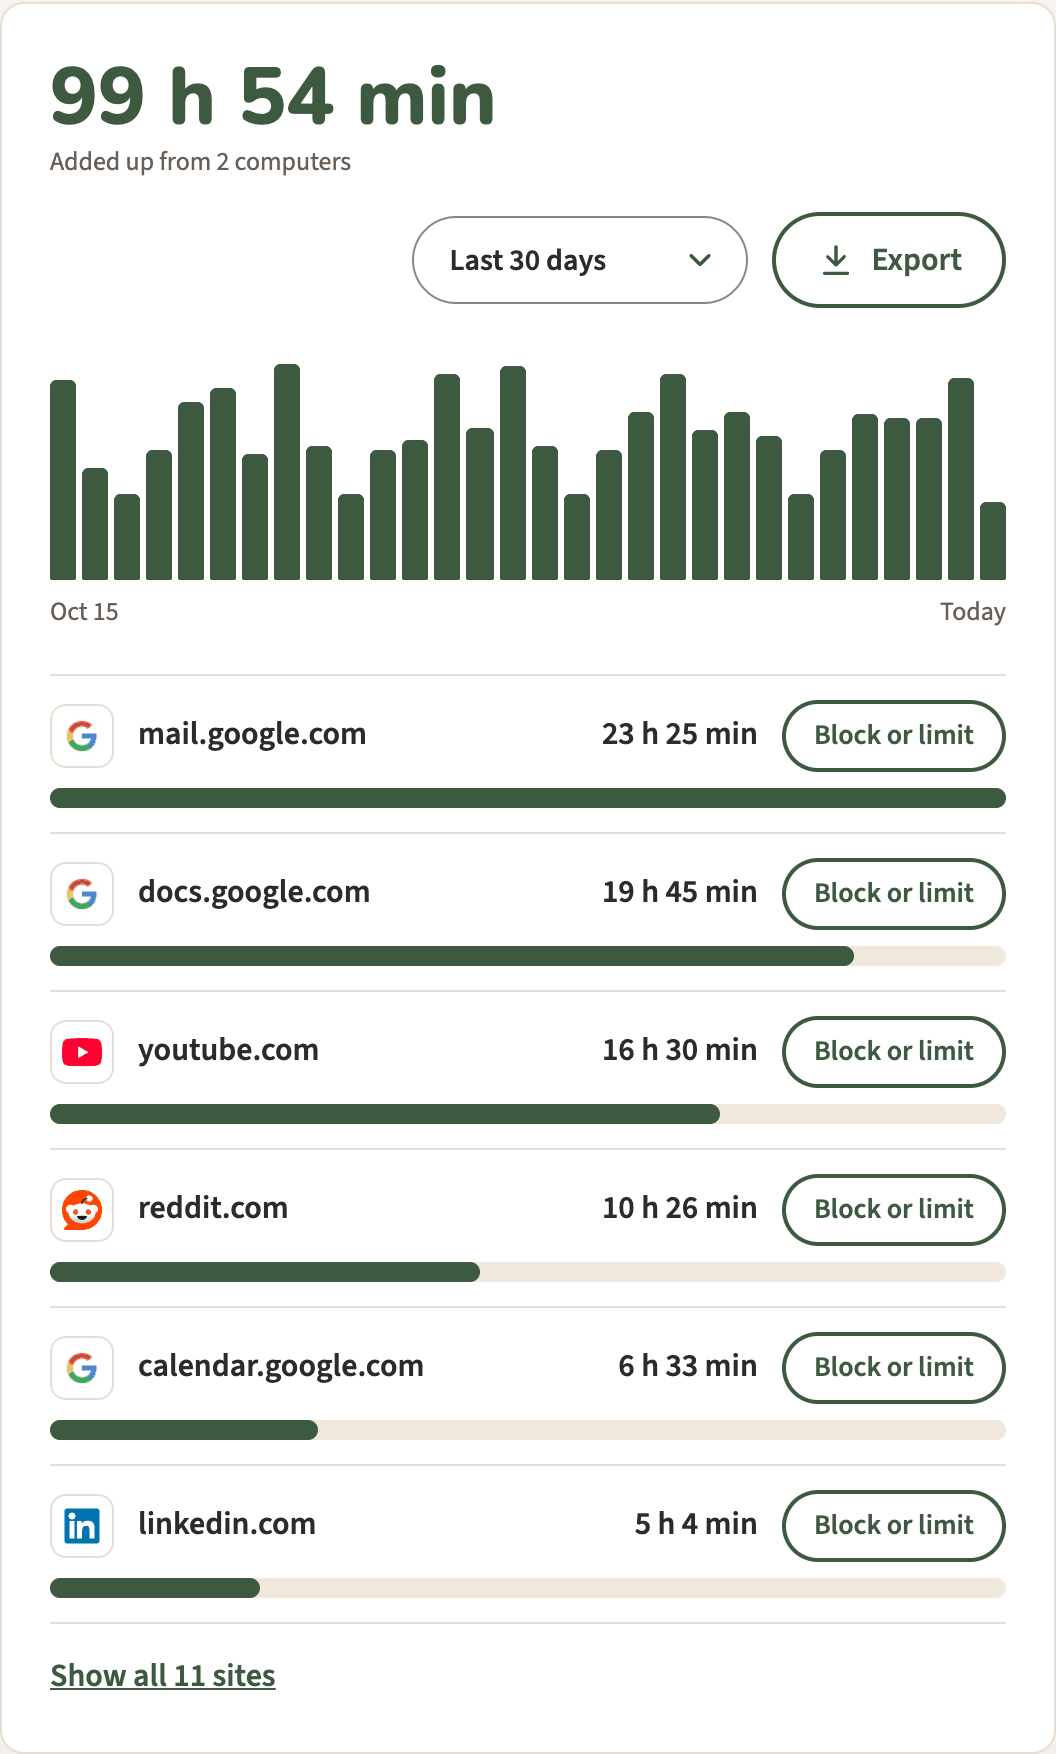
Over the last 30 days of the same example, the order is the same as in the week: mail.google.com first with 23 h 25 min, then docs.google.com, youtube.com, reddit.com and calendar.google.com. When a month has the same order as a week, the week was typical, not a fluke. Last 30 days comes with the trial or the plan.
Patterns to look for
- Where the morning goes. Screen time adds up whole days, not hours. To see a morning, open Today at lunchtime: it shows what’s been counted so far. If email leads by noon most days, the morning is going to the inbox.
- Long days. A tall bar is a day that ran long. Export lists each day site by site, so you can see what filled it.
- Weekends. In Last 7 days, compare Saturday and Sunday with the weekdays. Tall weekend bars mean work, or browsing, has spread into the weekend.
- The change from last week. A single week’s change can be noise. Look for the same direction several weeks running.
What totals can’t show
Totals don’t show how often you switched. Five hours of email could be five long sittings or a hundred short checks. Researchers who observed 24 information workers at one company in 2005 found they spent about 11 minutes, on average, on one piece of work before switching or being interrupted. More than half of those pieces of work were interrupted. It was a small study at one company, but it’s a reminder that a day can be broken up in ways a total doesn’t show.
What to try next week
Seeing your numbers isn’t enough on its own. A review of 138 experiments found that keeping track of progress toward a goal helps a little on average, more so when progress is written down or shared. Most of those goals were about health, not screens. A small study of pop-up warnings about phone use found they didn’t cut screen time. So pair the numbers with a goal and a plan:
- Pick one site and one number. For example, reddit.com under 2 hours next week.
- Choose how. Check email at set times, block a site during work hours, or select Block or limit next to it and give it a Daily limit (with the trial or the plan).
- Change one thing at a time, so you can tell what worked.
- Read the Monday email. It always has the week’s total, and with the plan, the change and the top 5 sites.
For social sites in particular, see how to cut your social media time in half.
See your own week in Screen time
Pawsome Family’s Screen time counts the minutes each website is on your screen in Chrome and Edge, and sends a summary every Monday. It keeps only site names and minutes, never the pages you read. The help page covers every setting.
Free for 30 days, with no card needed.